
Three characteristic speeds
For an ideal gas, the most probable speed is √(2RT/M), the mean speed is √(8RT/πM), and the RMS speed is √(3RT/M). Their order is most probable < mean < RMS. Use kelvin and kg/mol when R is in SI units.
Opening your lab guide…
The simulation has closed. Your guide is on its way.
LIVE LAB 20 • STATES OF MATTER & KINETIC THEORY
Explore molecular motion and speed distributions in 3D. Change temperature and gas mass, compare fixed speed bands and practise 20 questions with worked solutions.
Open paid simulation →Purchase this simulation or get all paid labs with a subscription. View prices →
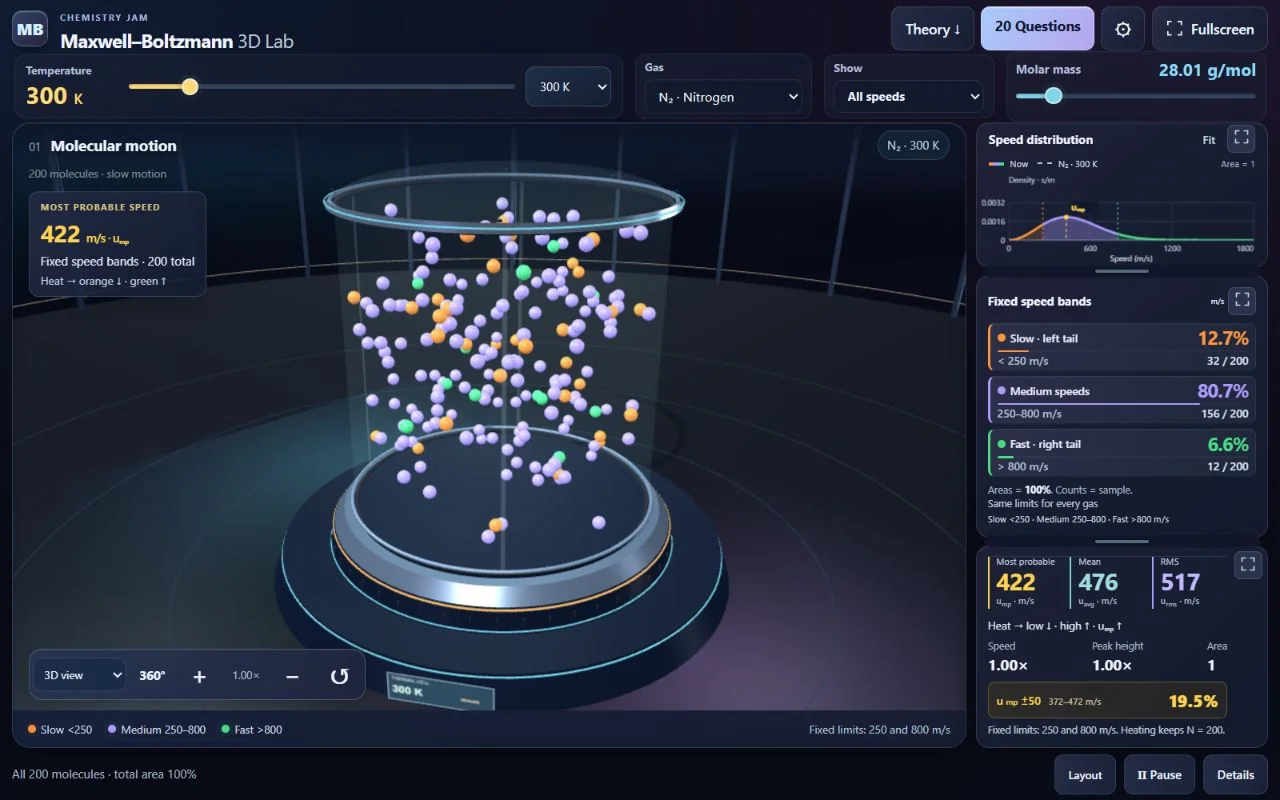 ACTUAL LAB PREVIEW
QUICK START
COMPLETE CONCEPT GUIDE
Even at one temperature, gas molecules have a range of speeds. Compare the particle view with a normalised speed-distribution curve and connect changes in its shape with temperature and molar mass.
For an ideal gas, the most probable speed is √(2RT/M), the mean speed is √(8RT/πM), and the RMS speed is √(3RT/M). Their order is most probable < mean < RMS. Use kelvin and kg/mol when R is in SI units.
For a fixed gas, characteristic speeds scale with √T. Heating shifts the peak toward higher speeds and broadens the curve. The area under a normalised probability-density curve remains one; the peak height is not the number of molecules.
For the same gas heated from 300 K to 600 K, every characteristic speed increases by √(600/300) = √2 ≈ 1.414. Average translational kinetic energy doubles, while the normalised area under the speed-distribution curve stays one.
Characteristic speeds scale as 1/√M. A lighter gas has a distribution shifted toward higher speeds, but ideal gases at the same temperature have the same average translational kinetic energy per molecule.
The fraction of molecules between two speeds is the area under the curve across that interval. Keep the interval boundaries fixed when comparing temperatures. The finite animated sample fluctuates around the theoretical fractions.
MAXWELL–BOLTZMANN FAQ
It shows the probability density for molecular speeds in a gas at thermal equilibrium. The area between two speeds gives the fraction in that interval; the height at one speed is not itself a fraction.
For the same gas, the most probable, mean and RMS speeds each increase by √2, approximately 1.414. They do not double.
Squaring speeds gives larger values more weight. Taking the square root after averaging therefore gives a larger result than the arithmetic mean when the speeds vary.
RELATED SIMULATIONS
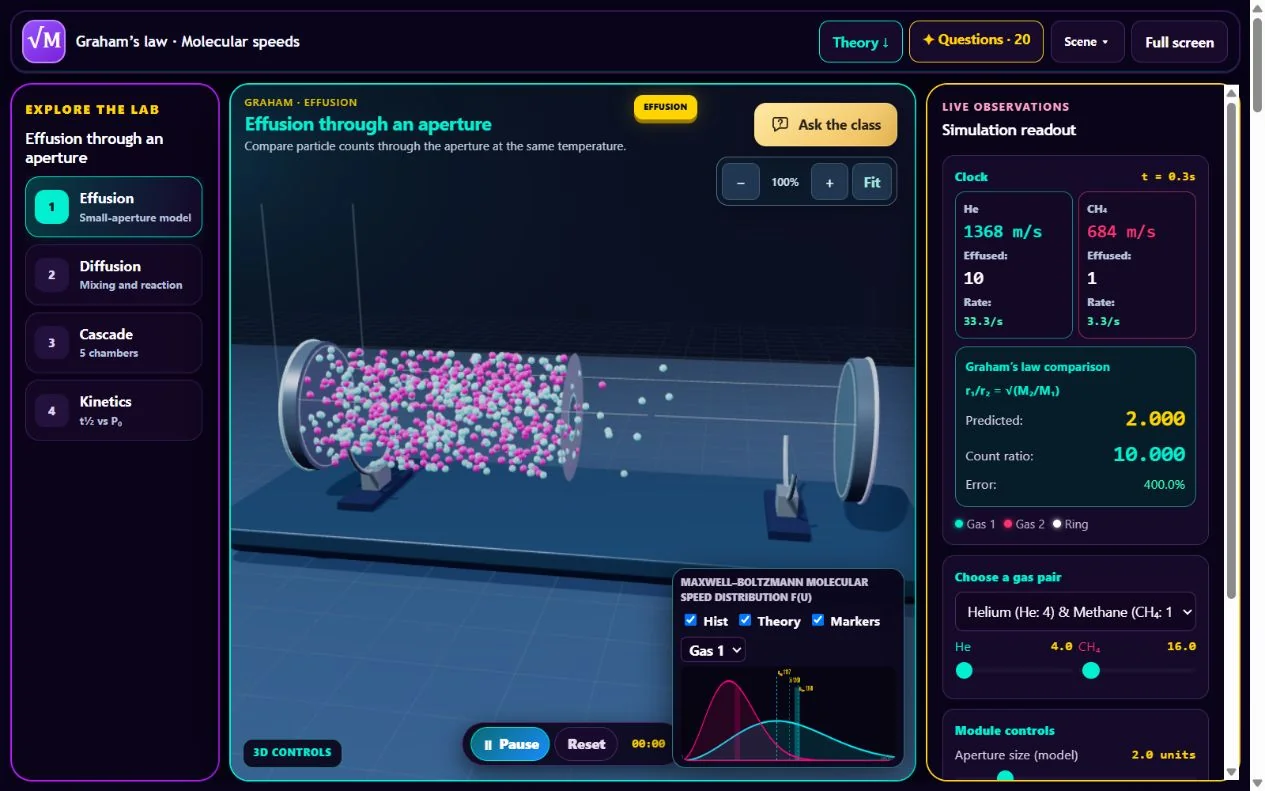 States of Matter & Kinetic Theory
Compare effusion, diffusion and molecular-speed distributions in an interactive gas lab, then connect rate ratios with molar mass and temperature.
Open related lab →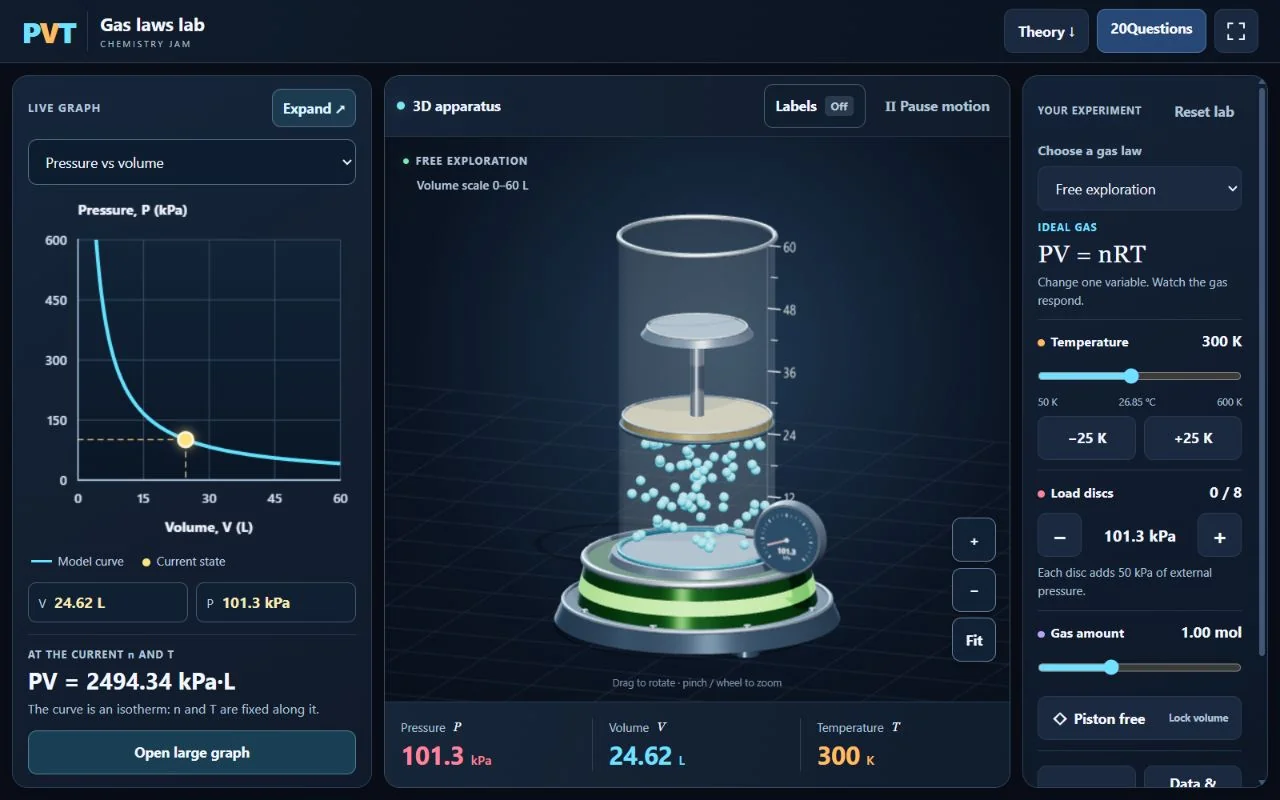 States of Matter & Gas Laws
Explore pressure, volume, temperature and amount in a live piston model, trace gas-law curves, collect data and connect macroscopic changes with particle motion.
Open related lab →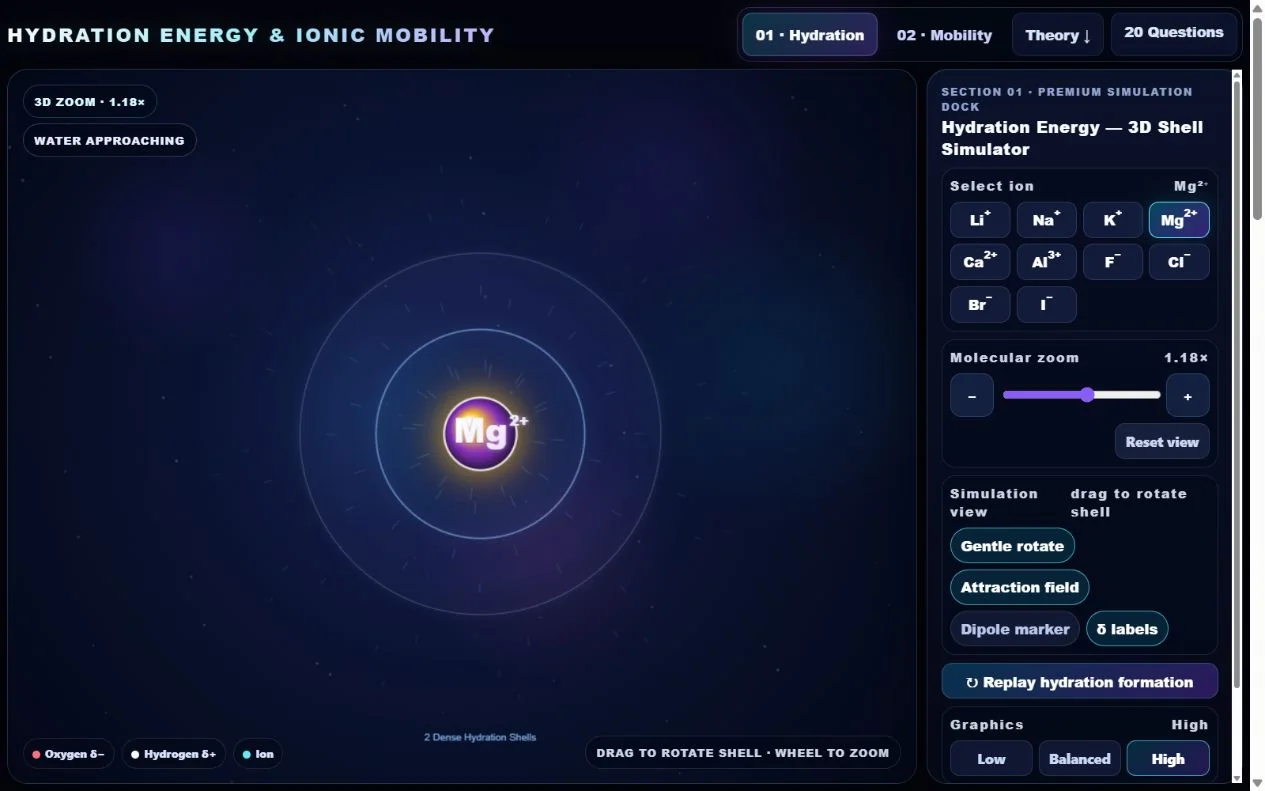 Electrochemistry
Watch water dipoles approach, orient and lock around an ion in a rotatable 3D hydration shell, then compare realistic hydrated-ion motion in an electric field.
Open related lab →READING THE DISTRIBUTION
Speed and energy are different axes. This lab plots molecular speed. Kinetics questions often plot molecular energy: E = ½mv². The density curve must be transformed when changing variables; simply relabelling the speed axis does not give an energy-distribution curve. The lab does not simulate reaction rates or catalysis.
Connect this lab with related chemistry topics and choose the depth that fits your current studies.
STUDENT DISCUSSION
Loading discussion…
This lab focuses on the speed distribution, characteristic speeds and speed-band fractions. The separate Graham’s Law lab connects molecular motion with effusion and diffusion comparisons.
Comments stay outside the simulation. When you exit the lab, you can choose to share a question or observation.